Intel® VTune™ Profiler for CPU and GPU profiling
Overview
Intel® VTune™ Profiler is a performance analysis tool for applications and systems, which helps in analyzing and optimizing the application performance, system performance and system configuration. The profiling can be executed on a CPU, GPU or FPGA. It can profile both single-threaded as well as multi-threaded applications. Refer the Get Started with Intel® VTune™ Profiler for more details on Intel® VTune™ Profiler.
Installation of Intel® VTune™ Profiler
Follow the Intel® VTune™ Profiler installation guide to install Intel® VTune™ Profiler by choosing one of the following two options:
Additional System Setup for CPU and GPU Profiling
Build and Install the Sampling Drivers for Linux Targets.
To do CPU and GPU profiling using driverless sampling collection on processors based on Intel® Performance Hybrid Architecture, which has been introduced from 12th Gen Intel® Core™ processors, the Intel® VTune™ Profiler sampling drivers must be installed and loaded using root credentials. Follow the steps to Build and Install the Sampling Drivers for Linux Targets.
System setup for CPU and GPU profiling.
As described in Set Up System for GPU Analysis, to analyze Intel® HD and Intel® Iris Graphics hardware events, the profiler requires that the “Intel Metric Discovery(MD) API” Library is installed and that the necessary permissions to enable the collecting of GPU hardware metrics.
Follow the steps Set Up System for GPU Analysis, to build and install the Intel Metric Discovery(MD) API Library.
Run the below command to grant relevant permission to enable the collecting of GPU hardware metrics for non-privileged users.
sudo sysctl -w dev.i915.perf_stream_paranoid=0

Run the below command to remove the limited scope of the “ptrace()” system call.
sudo sysctl -w kernel.yama.ptrace_scope=0
Run the below command to add the user to the video and render group.
sudo usermod -a -G video $USER
sudo usermod -a -G render $USER
Profiling an Application from Intel® Robotics SDK
The example application from Intel® Robotics SDK considered for the CPU and GPU profiling is the “Collaborative visual slam with fastmapping enabled” application from the Collaborative Visual SLAM tutorial. The two CPU analyses types considered in this example are CPU Hotspots analysis and CPU Microarchitecture Exploration analysis. Furthermore, the GPU analysis type considered is GPU Offload analysis. The CPU and GPU profiling are carried out using the vtune command line tool. However, the vtune-gui tool is later used to visualize and understand the findings.
CPU Profiling
CPU Hotspots Analysis
The CPU Hotspots Analysis is carried out with the following parameters:
Hardware sampling enabled with sampling interval of 5ms.
Stack collection enabled with stack size of 2048B.
The application is called directly by the profiler.
The profiler runs and profiles the application for 30 seconds and terminates the application.
Steps to run CPU Hotspots Analysis
Install the “Collaborative visual slam with fastmapping enabled” application from the Collaborative Visual SLAM tutorial.
Run the below command to source the ROS2 setup files.
source /opt/ros/humble/setup.bash
Run the below command to set the ROS_DOMAIN_ID.
export ROS_DOMAIN_ID=67
Run the below command to source the VTune environment
source /opt/intel/oneapi/vtune/latest/env/vars.sh
Run the below command on the terminal to start the CPU Hotspots Analysis of the “Collaborative visual slam with fastmapping enabled” application from the Collaborative Visual SLAM tutorial.
vtune -collect hotspots -knob sampling-mode=hw -knob sampling-interval=5 -knob enable-stack-collection=true -knob stack-size=2048 -duration=30 -result-dir ./vtune_results_hotspots /opt/ros/humble/share/collab-slam/tutorial-fastmapping/cslam-fastmapping.sh
The results are collected in vtune_results_hotspots directory.
Note
The sampling interval and the duration can be changed by adapting the value of the parameters -sampling-interval and -duration respectively.
Analysis of the CPU Hotspots Results
After the CPU Hotspots Analysis results are saved, open the vtune-gui by running the following command.
vtune-gui
Now click on the open-results button on the left side of the tool, browse to the directory vtune_results_hotspots, select the vtune_results_hotspots.vtune file and click on open. This will open the CPU Hotspots Analysis results for the “Collaborative visual slam with fastmapping enabled” application from the Collaborative Visual SLAM tutorial which ran for 30 seconds.
From the summary page, some of the CPU Hotspots Analysis details that can be observed are mentioned below. Refer to the page, Run and Interpret Hotspots Analysis, for more details on the CPU Hotspots Analysis using Intel® VTune™ Profiler.
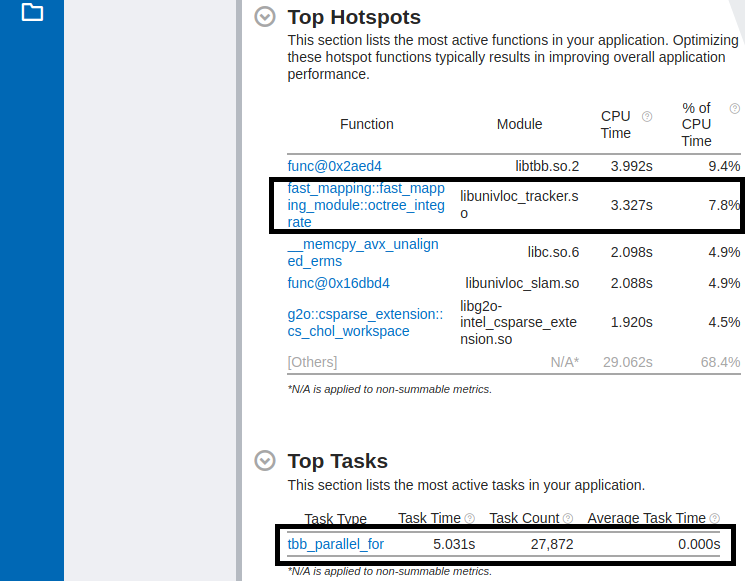
Top Hotspots and the Top Tasks
The below picture showcases the most active functions in the application, the total CPU time it has run and the % of CPU time it has utilized. For example, here, it can be observed that from the “Collaborative visual slam with fastmapping enabled” application from the Collaborative Visual SLAM tutorial, the function fast_mapping::fast_mapping_module::octree_integrate is the second most active function consuming 7.8% of CPU time. Also the top running task is tbb_parallel_for with a task time of 5.031 seconds and the task being called 27,872 times as shown under “Task Count” column.
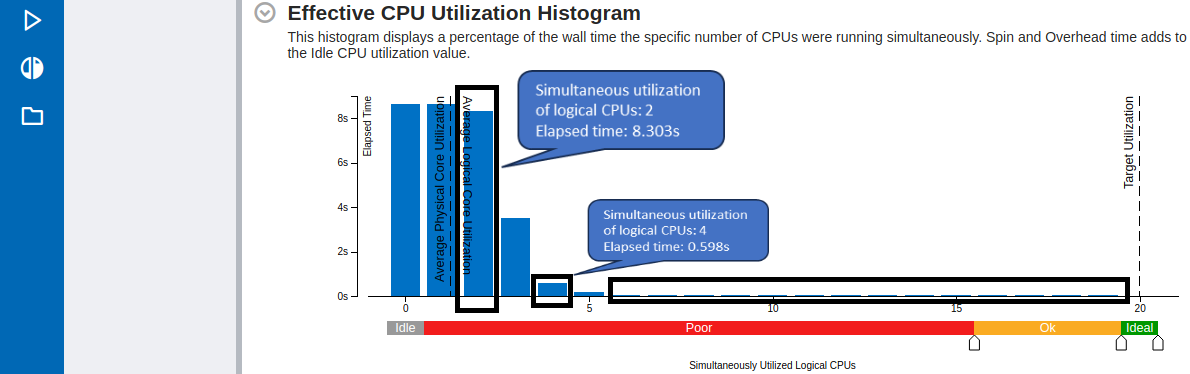
Effective CPU Utilization Histogram
The below histogram shows the effective CPU core utilization when the application is running. From the below picture it can be observed that the effective elapsed time wherein two logical CPU cores are utilized is slightly above 8 seconds. On the other hand, the effective elapsed time wherein four logical CPU cores are utilized is slightly greater than 0.5 seconds. It can also be observed that at no time six or more logical CPU cores are utilized simultaneously.
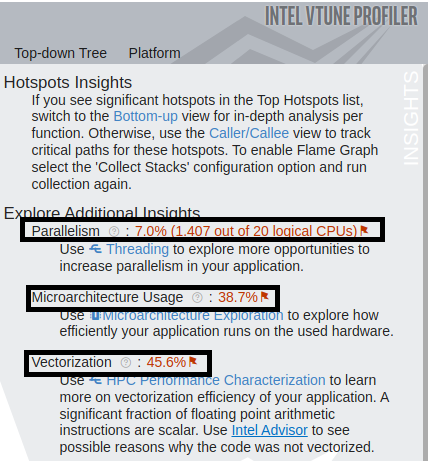
Additional Insights
Under “Explore Additional Insights” section, an overview of the following can be observed. This will encourage to further explore the relevant analysis types which further helps in the optimization of the application.
Parallelism: On an average how many CPUs out of total available CPUs were utilized. Here 1.407 out of available 20 logical CPUs were utilized.
Microarchitecture usage: This gives an estimate (in %) on how effectively the application has utilized the underlying hardware architecture.
CPU Microarchitecture Exploration
The CPU Microarchitecture Exploration is carried out with the following parameters:
Hardware sampling enabled with sampling interval of 5ms.
The application is called directly by the profiler.
The profiler runs and profiles the application for 30 seconds and terminates the application.
Steps to run CPU Microarchitecture Exploration
Install the “Collaborative visual slam with fastmapping enabled” application from the Collaborative Visual SLAM tutorial.
Run the below command to source the ROS2 setup files.
source /opt/ros/humble/setup.bash
Run the below command to set the ROS_DOMAIN_ID.
export ROS_DOMAIN_ID=67
Run the below command to source the VTune environment
source /opt/intel/oneapi/vtune/latest/env/vars.sh
Run the below command on the terminal to start the CPU Microarchitecture Exploration of the “Collaborative visual slam with fastmapping enabled” application from the Collaborative Visual SLAM tutorial.
vtune -collect uarch-exploration -knob sampling-interval=5 -duration=30 -result-dir=./vtune_results_uarch /opt/ros/humble/share/collab-slam/tutorial-fastmapping/cslam-fastmapping.sh
The results are collected in vtune_results_uarch directory.
Note
The sampling interval and the duration can be changed by adapting the value of the parameters sampling-interval and -duration respectively.
Analysis of the CPU Microarchitecture Exploration results
After the CPU Microarchitecture Exploration results are saved, open the vtune-gui by running the following command.
vtune-gui
Now click on the open-results button on the left side of the tool, browse to the directory vtune_results_uarch, select the vtune_results_uarch.vtune file and click on open. This will open the CPU Microarchitecture Exploration results for the “Collaborative visual slam with fastmapping enabled” application from the Collaborative Visual SLAM tutorial which ran for 30 seconds.
From the summary page, some of the CPU Microarchitecture Exploration details that can be observed are mentioned below. Refer to the page, Analyze Microarchitecture Usage, for more details on the CPU Microarchitecture Exploration using Intel® VTune™ Profiler.
P-core and E-core execution summary
The below picture showcases the execution summary of the application running on P-cores and E-cores. This gives an overview on percentage of retired instructions on P-core and E-core respectively, percentage of slots during which the CPU was waiting due to front-end bound and back-end bound latencies on P-core and E-core respectively and many other parameters giving a comparison between the tasks executing on P-core and E-core respectively.

CPU Bandwidth utilization
Click on Platform tab to see the CPU Bandwidth utilization. The below picture shows the CPU bandwidth usage by different threads of the running application.
